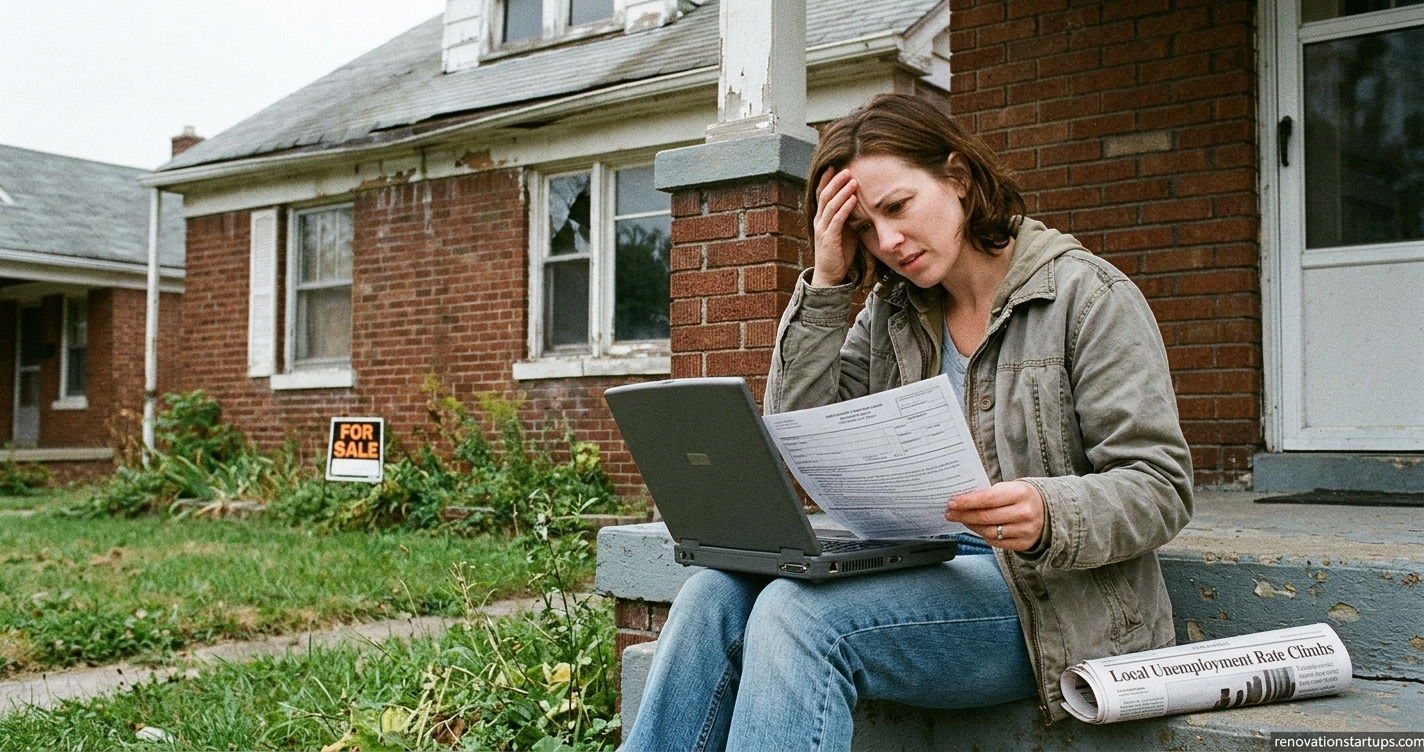
The unemployment rate is the percentage of the labour force that has no job but is available to work and actively searching for one. Statistics Canada publishes it every month, and in October 2026 it reached 6.7%. That works out to roughly one in every fifteen people in the labour force.
Ever heard that figure on the radio and wondered what it actually counts? Most of us have. Let’s work through it together, one piece at a time.
What is the unemployment rate and who counts as unemployed?
Picture the labour force as everyone aged 15 and older who is either working or looking for work. Students who are not searching, retirees and full-time caregivers sit outside it. Here is the part that surprises people: someone who gave up looking six months ago is not counted as unemployed, even though they have no job.
Statistics Canada applies three tests. You must have been without work during the survey week, be ready to start, and have searched for work in the previous four weeks or be waiting to start a job or return from a temporary layoff. Fail one test and you are classed as not in the labour force. It sounds harsh, but it keeps the measure consistent from one month to the next.
How is the unemployment rate calculated in Canada?
The maths is simple. The sampling behind it is serious work. Every month, the Labour Force Survey questions about 65,000 households and scales the answers up to represent the whole population.
The formula
Divide the number of unemployed people by the labour force, then multiply by 100.
A worked example
In October 2026, about 1.5 million people were unemployed in a labour force of roughly 22.6 million. Divide one by the other and you land on 6.7%. Try it on a calculator. It takes ten seconds.
Why it is not a count of benefit claims
Plenty of unemployed people never apply for Employment Insurance, and some claimants are already working part time. A survey built on international definitions captures both groups, which is why Canada can compare itself with other countries on equal terms.
What is Canada’s current unemployment rate?
The headline number rose from 6.5% in September 2026 to 6.7% in October, the second monthly increase in a row. It still sits below the 6.9% peak recorded in April 2026. Employment barely moved, down by roughly 4,700 jobs, but more people started searching, and that alone pushes the figure up.
Where you live matters a lot. Manitoba had the lowest figure at 5.0%, while New foundland and Labrador had the highest at 8.7%. Ontario and Alberta both landed at 7.3%. Young people had it toughest, with the 15 to 24 group at 13.7%.
A word of caution from me: one month of data is noisy. A swing of a tenth or two can be sampling error, so I would trust a three-month trend over a single headline every time. 📈
Why does the unemployment rate go up or down?
Economists sort joblessness into four types, and each one has a different cause and a different fix.
Frictional unemployment
These are short gaps between jobs. A graduate in Halifax searching for a first role is a classic case. Some of it is healthy, because it means people are moving toward better matches.
Structural unemployment
Here, workers’ skills or locations do not match available openings. Retail shows it clearly: employment in wholesale and retail trade fell by about 113,000 over the 12 months to October 2026. Those workers do not all slot neatly into other sectors.
Cyclical unemployment
When the economy cools, businesses hire less. Higher borrowing costs, which follow the Bank of Canada’s policy rate, can feed into this, since companies delay expansion when loans get pricier. This type rises and falls with the business cycle.
Seasonal unemployment
Tourism, agriculture and construction follow the calendar, and a Canadian winter makes the swings obvious. Headline figures are seasonally adjusted so these predictable patterns do not distort the trend.
Does the unemployment rate show the whole picture?
Not quite. It misses discouraged workers who stopped searching, and it treats someone working five hours a week as fully employed. It also says nothing about pay or job security.
Long searches tell a story too. In October 2026, about 23.7% of unemployed Canadians had been looking for 27 weeks or more, compared with a pre-pandemic average of 17.2%. People aged 55 and older fared worst, at 32.7%. Finding work is simply taking longer.
So when I read a monthly release, I check these alongside the headline:
- Participation rate, which sat at 64.8% in October 2026
- Employment rate, which was 60.5%
- Share of long-term searchers
- Youth and regional figures

What does a rising jobless figure mean for you?
Honestly, the answer depends on your situation. If you work in a sector that is shedding jobs, such as retail right now, it is worth updating your resume before you need it. If you are job hunting, expect more competition per posting and a longer search.
Employment Insurance is tied to local conditions. Regional jobless figures influence how many insured hours you need and how long benefits can last, so the same work history can lead to different outcomes in Fredericton and Calgary. Check Service Canada for the exact rules, because they change.
Job Bank, run by the federal government, is free and lists openings by region. Short courses and apprenticeships can also help you move toward growing fields like construction, which added about 47,000 jobs over the year to October 2026. Does that guarantee a job? No. It does improve your odds.
Where can you follow the monthly numbers?
Statistics Canada posts each Labour Force Survey release in The Daily, along with tables by province, age group and city. Open the highlights first, then jump to the table for your province. Ten minutes a month is enough to stay ahead of the headlines, and you will spot trends long before they reach the evening news.
FAQ
What is a good unemployment rate?
There is no single magic number. Estimates of Canada’s sustainable level usually fall somewhere near 5% to 6%, though they shift over time. Below that, employers can struggle to hire. Far above it, hardship spreads.
Why is Canada’s unemployment rate so high?
Slow hiring is the main reason. Employment grew by only about 17,000 in the 12 months to October 2026, while the working-age population kept growing, so more people were chasing roughly the same number of jobs. Nobody can promise when that turns around.
Who is not counted as unemployed?
Full-time students who are not searching, retirees, and anyone who has stopped looking for work. Statistics Canada tracks them as outside the labour force.
When does Statistics Canada update the numbers?
Monthly, through a new Labour Force Survey release, which you can find on the agency’s website.
